A simple explanation of Regression analysis

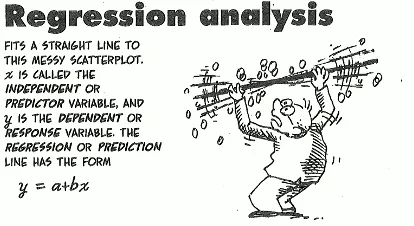
Regression analysis is a commonly used tool in scientific and statistical research. Though it’s widely used, its ins and outs can be a tad unclear. At its core, regression analysis examines the relationship between variables and determines their correlations.
Understanding Correlation
Correlation is a statistical metric that tells us how two variables move in relation to each other. If you have two variables, x and y, and they both increase or decrease together, they have a positive correlation. Think of winter: as the temperature drops (variable x), the chances of snowfall increase (variable y). This positive relation between cold temperatures and snow illustrates a positive correlation.
In contrast, when one variable goes up while the other goes down, you’re looking at a negative correlation. A real-life example could be sunshine and rain. Typically, when the sun is shining brightly (variable x is high), the likelihood of rain (variable y) decreases.
When handling vast datasets, understanding these correlations becomes crucial. Let’s take the example of a dataset that captures the academic performance of students in Surulere LGA. This dataset might contain a plethora of variables – from gender to socioeconomic background, from parental education levels to extracurricular activities, and so on. Here’s where regression analysis steps in as a powerful tool. It allows researchers to isolates variables to observe how they correlate with each other.
To visualize, picture each student from Surulere LGA as a unique circuit board. This board is fitted with various switches, with each switch representing a different variable or data point, such as scores in mathematics, proficiency in language arts, or even the income bracket of their family. By studying these “circuit boards,” researchers can pinpoint patterns and underlying relationships in the data. This analogy helps researchers identify trends and relationships. By comparing students with similar “switch settings,” a researcher can zero in on distinct characteristics and assess their impacts.
The Limitations: Correlation is not causation
To highlight a key limitation of regression analysis, let’s delve into an example. Suppose we investigate the potential connection between the quantity of books in a household and a child’s academic performance. On collating the data, we might find that there’s a noticeable positive correlation: children in homes with extensive book collections tend to achieve higher grades.
But here’s where it gets tricky. While regression analysis can pinpoint this correlation, it can’t tell us why it exists. Is it the direct influence of the books that bolsters academic performance? Or could it be that households valuing education both buy more books and also invest more in their children’s learning in other ways? Perhaps parents in such homes are more likely to spend time reading to their children, engage in intellectual conversations, or prioritize academic assistance.
This distinction between correlation (a mutual relationship where two variables move together) and causation (where a change in one variable is responsible for a change in another) is critical. While a correlation can be a signpost pointing researchers in a specific direction, it’s just the beginning. Understanding the underlying causal mechanisms demands more rigorous, often experimental, studies where other influencing factors are controlled. For instance, to truly gauge the impact of books on academic success, researchers might want to account for parental education levels, the quality of schools attended, the child’s access to tutoring, and even the child’s innate aptitude. Only by meticulously examining these factors can we begin to tease apart correlation from genuine causation.
While regression analysis is undeniably powerful, it’s vital to wield it with caution and an understanding of its boundaries. Recognizing the difference between correlation and causation not only guards against over-simplifications but also paves the way for richer, more nuanced insights.
References: Freakonomics by Steven D. Levitt and Stephen J. Dubner; image, fiverr.com.